Year in review

A year in review they’ll actually share

Turn a year of activity into a recap each customer wants to watch and share: their visits, their milestones, and what comes next.

53% share rate on the Cleveland Cavaliers season recap

A recap built from each customer’s year

Their numbers, their story

Games attended, nights stayed, or orders placed, told as a story about the viewer instead of a report.

Year in review video telling a member’s year in numbers

Questions inside the video

Ask about plans for the year ahead and collect each answer as the customer watches.

In-video poll asking about plans for next year

Made to share

Give fans and members a recap worth posting, so every share carries your brand to new audiences.

Year in review recap shared as a social post

Year in review videos in action

Press play on real recaps that our customers sent to their members and fans.

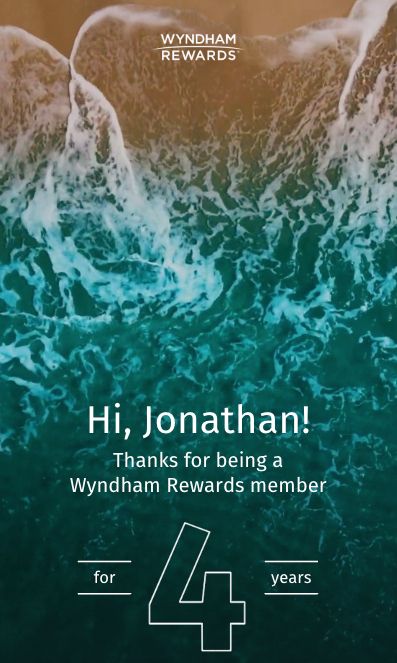
How Wyndham boosted email CTR by 75% and achieved a 66.7% survey completion rate with personalized year-end recap videos Hospitality
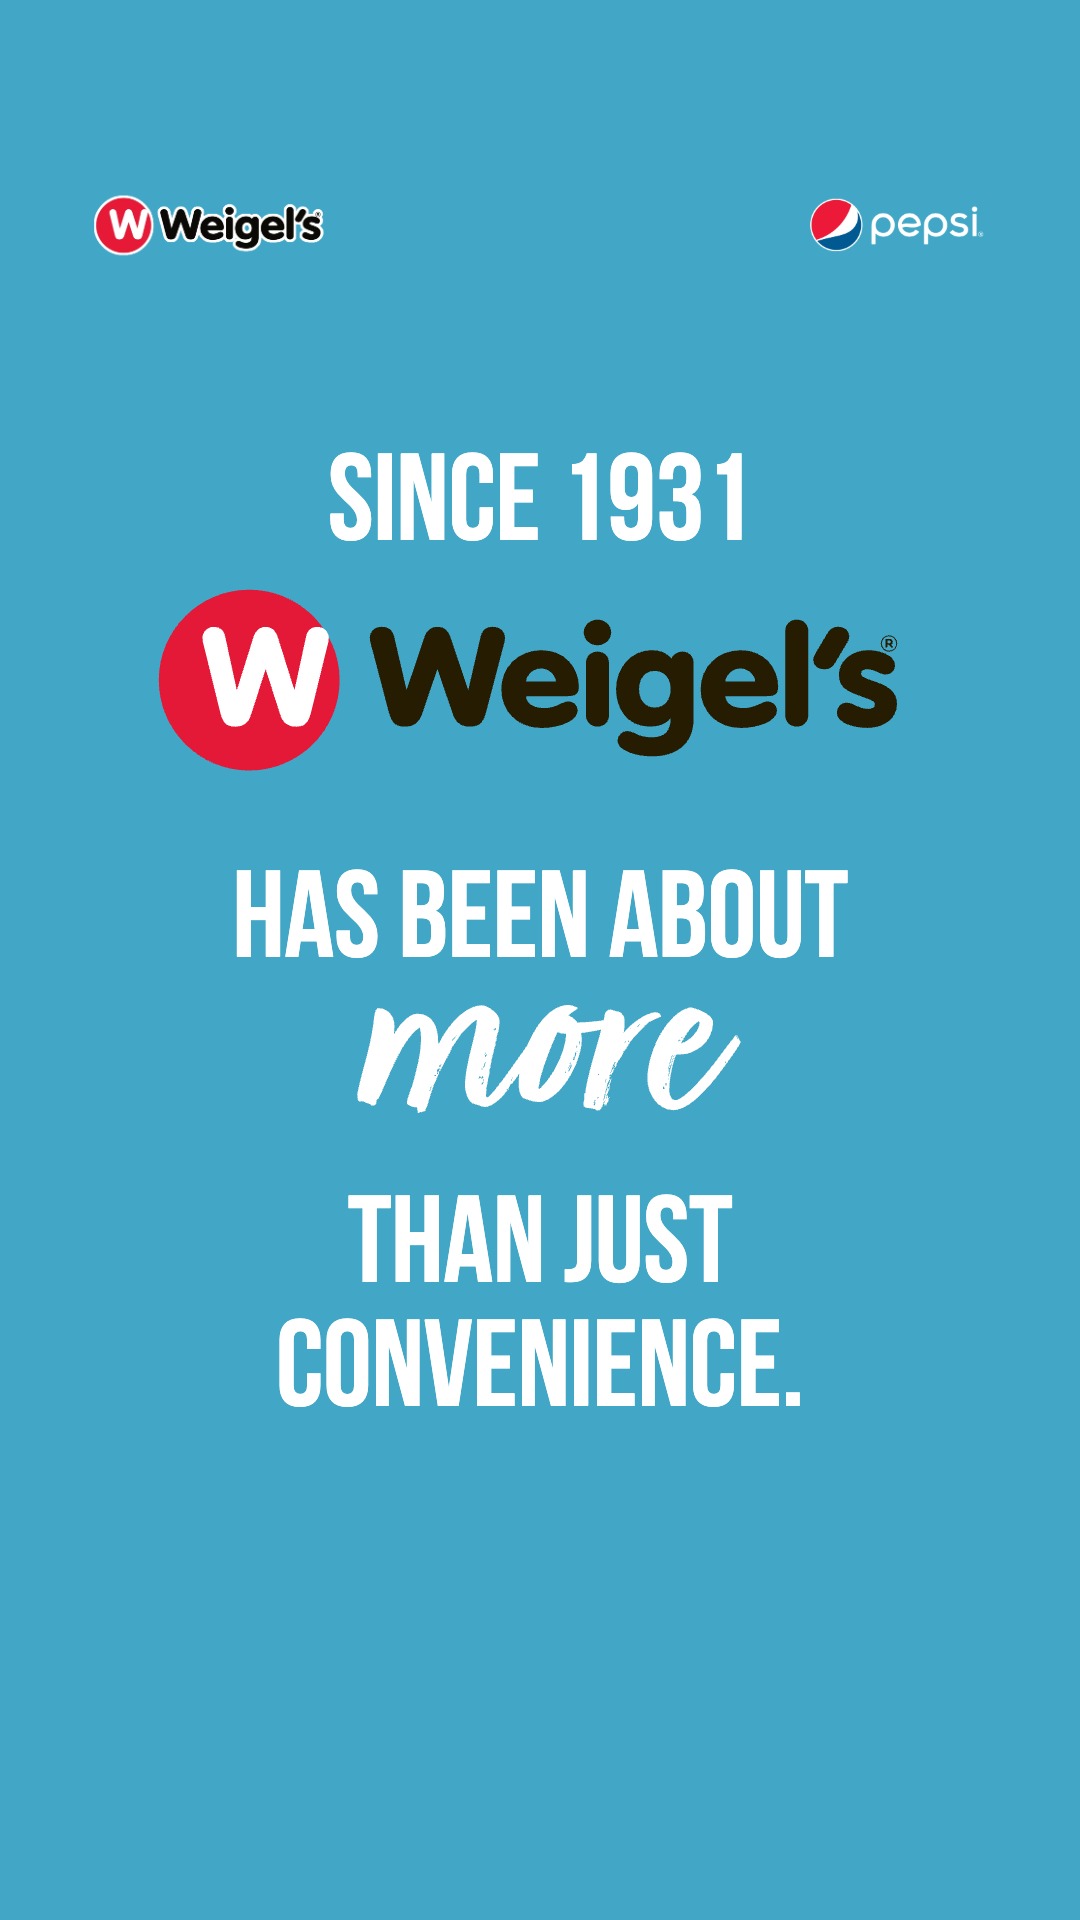
Weigel’s: a rewards anniversary recap for every member Convenience retail
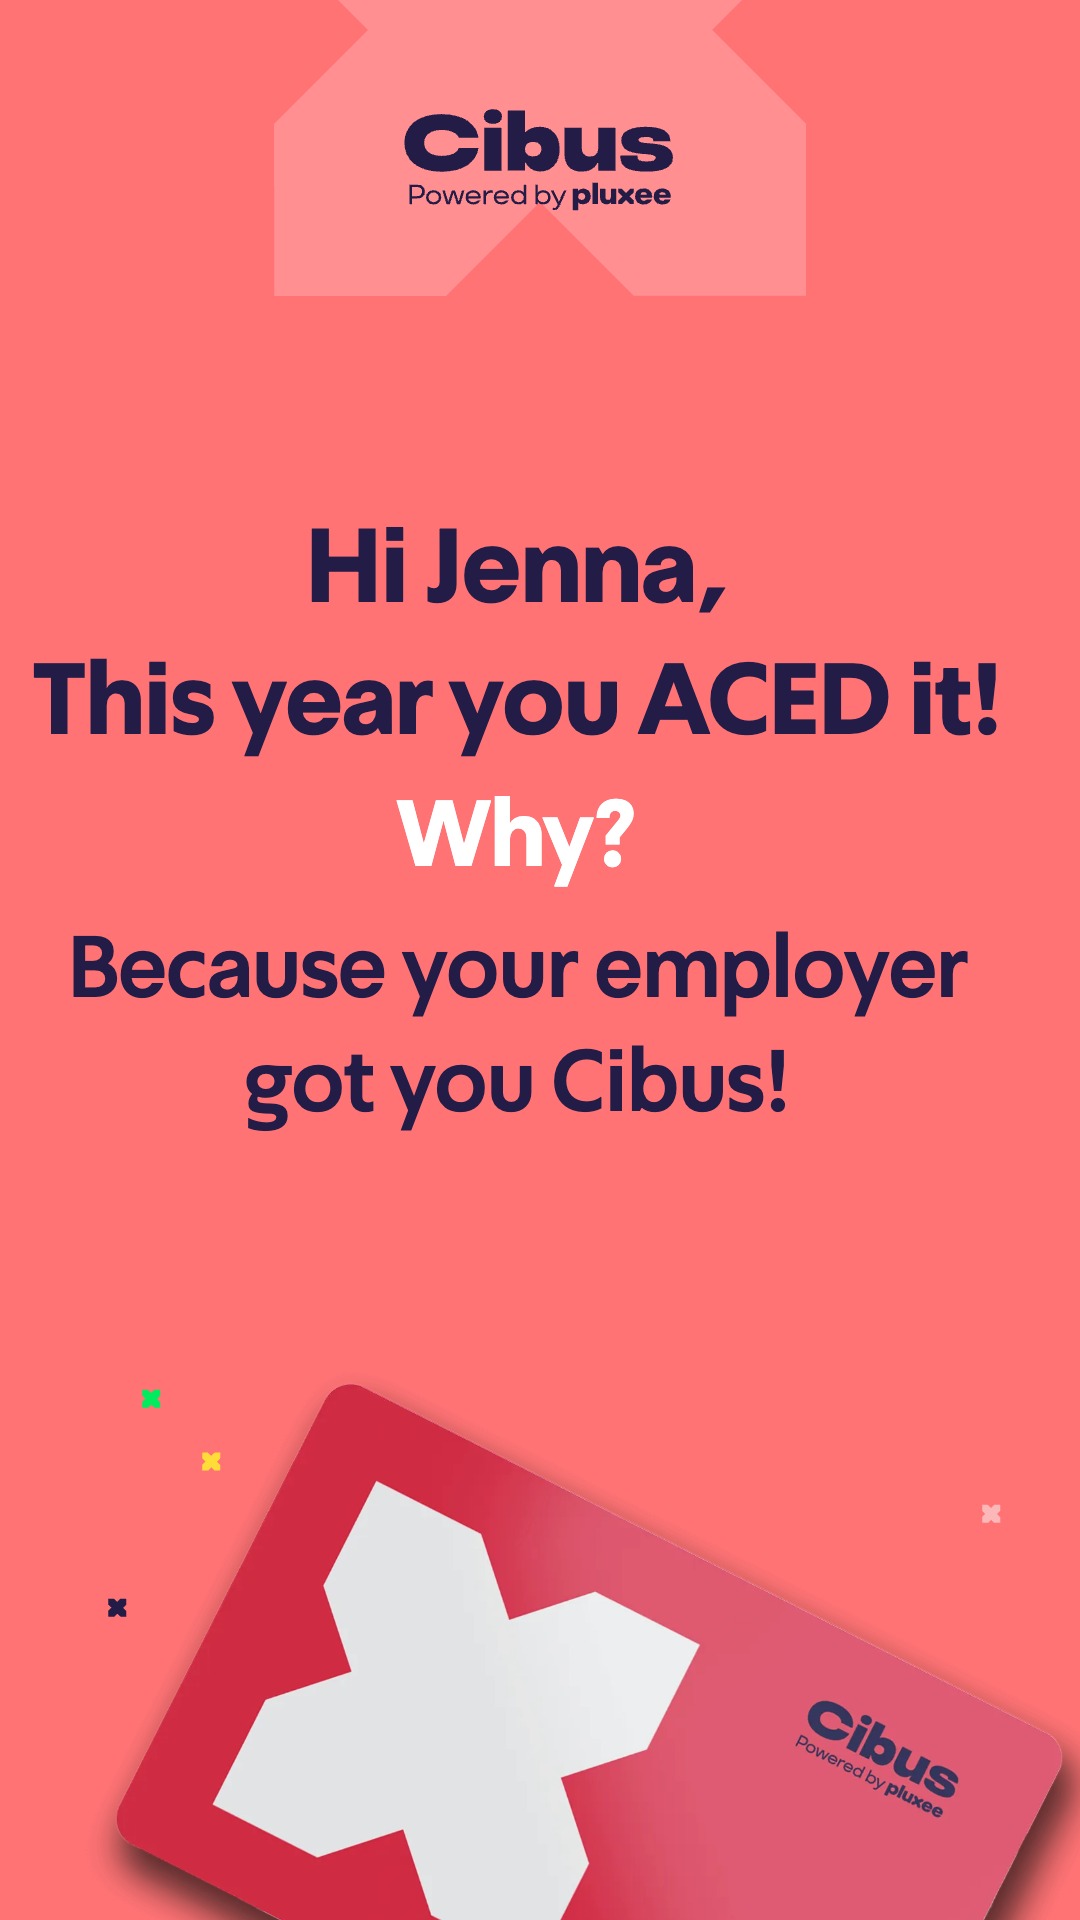
How Cibus Pluxee boosted user engagement and achieved outstanding opt-in marketing rates with a yearly recap interactive video Employee benefits
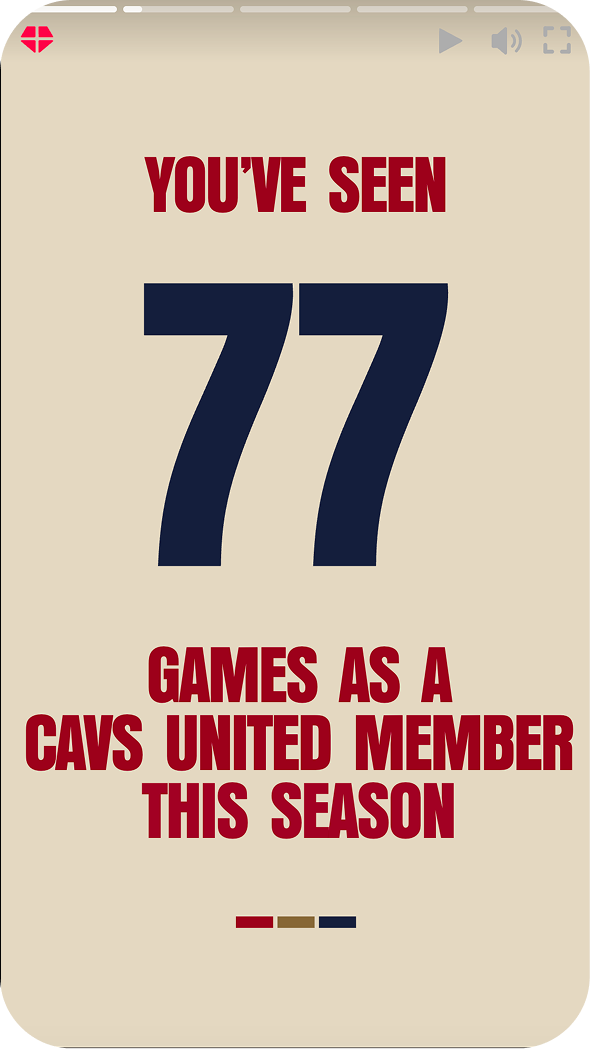
How the Cavs increased engagement and boosted fan loyalty with a hyper-personalized video Sports

A 75% lift in email click-through and a 66.7% survey completion rate, more than triple the 19% industry average, from personalized year-end travel recaps.

Learn more

Each myWeigel’s Rewards member sees their own year: store visits, Wednesday deals, total savings, and points earned.

A 124% interactivity rate, 51 seconds of average watch time, and 6.8% opting in to marketing from a yearly recap built on 14 personal data points.

Learn more

A 62% open rate, 22% click-through, a 53% share rate, and 84% completion from a season recap built on each fan’s own numbers.

Learn more

Recaps people finish, answer, and share

Results from year in review videos built on Blings.

Click-through lift, Wyndham
75%
Survey completion, Wyndham
66.7%
Share rate, Cavs
53%

Trusted by

Meital Shaham
Meital Shaham
Chief Marketing Officer CMO & CPO
Cibus

“The personalized Yearly Recap video created an unforgettable experience for our users. By showcasing each user’ unique data and making the interaction fun and engaging, we saw significant results in both user engagement and Marketing opt-in rates”

51s
Average watch time
124%
Engagement rate
6.8%
Marketing opt-in rate
Read the case study

Frequently asked questions

What is a personalized year in review video?

A recap video each customer receives at the end of the year or season, built from their own activity data. Every viewer sees their own numbers and milestones.

Which data works best in a recap?

Counts and highlights customers recognize: visits, purchases, points earned, favorite items, games attended, and the moment that stood out most.

Can a recap collect feedback?

Yes. Questions inside the video gather preferences for the coming year. Wyndham reached a 66.7% survey completion rate this way, more than triple the 19% industry average.

When should we send a recap?

Close to the end of your year or season, when customers are already reflecting. Some brands also run mid-year or anniversary versions.

Your customers are waiting for great video experiences.

Schedule a custom demo